App Store Optimization (ASO) is the process of optimizing mobile apps to rank higher in an app store’s search results and top charts. With over 5 million apps across the major app stores like Google Play and the App Store, ASO is crucial for app visibility and organic user acquisition. This article provides an overview of the key factors that influence app store rankings and how developers can implement an effective ASO strategy.
We will cover important ASO topics, including keyword research, optimizing titles and descriptions, designing app icons and screenshots, leveraging ratings and reviews, A/B testing, and tracking key metrics. Understanding these best practices can lead to increased downloads, lower user acquisition costs, and higher retention and engagement rates. A successful ASO strategy requires continuously monitoring keyword rankings and tweaking optimization efforts based on performance.
👉🏾 Other Swiftspeed users also read: How to make money from apps Using Fremium app monetization
By learning how to research relevant keywords, craft compelling metadata, provide localized content, and analyze data, app builders can greatly improve their app’s discoverability. Implementing these ASO techniques at every stage, from pre-launch to post-release, is key for standing out in an already saturated app marketplace.
This guide outlines actionable tips to boost your app’s visibility and organic growth potential.
Table Of Contents.
What is App Store Optimization?
App Store Optimization (ASO) refers to the process of optimizing your app listing in app stores to improve its visibility and rankings and ultimately attract more organic users and app downloads. It involves a combination of keyword optimization, appealing app titles and descriptions, compelling app icons and screenshots, positive reviews and ratings, and other factors that contribute to making your app more discoverable in the crowded app marketplace.
ASO focuses on understanding the search behavior and preferences of potential users and aligning your app listing accordingly. By strategically incorporating relevant keywords into your app title, description, and other metadata, you can increase the chances of your app appearing in search results when users search for relevant terms.
👉🏾 Other Swiftspeed users also read: App Name Detailed Guidelines and Best Practices for Success
What Are the Benefits of App Store Optimization?
App Store Optimization (ASO) is a crucial aspect for every app builder looking to maximize their app’s visibility and reach in app stores. By implementing effective ASO techniques, app developers can reap several benefits that can significantly impact their app’s success.
1. Increased Visibility: ASO helps improve your app’s visibility in app store search results. By optimizing your app’s title, keywords, and description with relevant and targeted terms, you can increase the chances of your app appearing in search queries. This improved visibility can lead to a higher number of impressions and, ultimately, more organic downloads.
2. Better App Ranking: ASO plays a pivotal role in improving your app’s ranking within the app store. By optimizing various on-page elements such as app title, description, and screenshots, you can align your app’s content with user search intent and increase its chances of ranking higher in relevant search queries. Higher rankings lead to increased visibility, credibility, and, eventually, more app installations.
3. Enhanced User Engagement: Through ASO, you can create a compelling app listing that effectively communicates the value proposition of your app to potential users. By utilizing persuasive language, captivating visuals, and clear calls to action, you can entice users to download your app. A visually appealing icon, attractive screenshots, and an informative video showcase can significantly boost user engagement and positively impact conversion rates.
4. Targeted User Acquisition: ASO allows you to optimize your app listing for specific keywords, demographics, or target audiences. By conducting in-depth keyword research and understanding your target audience’s preferences and search behavior, you can tailor your app’s content to attract and engage your ideal users. This targeted approach increases the likelihood of acquiring high-quality users who are more likely to engage with and retain your app.
5. Cost-Effective Marketing: Implementing ASO techniques can be an extremely cost-effective way to boost your app’s visibility and organic downloads. Unlike other paid marketing channels, ASO focuses on optimizing your app’s listing directly in the app store, which can lead to long-term organic growth without hefty advertising budgets. By investing time and effort in ASO, you can leverage the app store’s organic traffic and reduce your dependence on paid marketing campaigns.
App Store Optimization Process
When it comes to app store optimization (ASO), implementing the right strategies can significantly impact your app’s visibility and user acquisition. Here are some proven best practices for optimizing your app listing in app stores:
1. Keyword Research
Keyword research is a crucial first step in app store optimization. By identifying the right keywords to target, you can improve your app’s visibility and attract more downloads. Here are some techniques to identify the best keywords:
Examine Competing Apps
Look at apps similar to yours and analyze the keywords they are ranking for. You can use App Annie, SensorTower, or Apptweak to see the keywords your competitors are optimizing for. Focus on keywords related to your app’s functionality and target audience.
Use Keyword Planner Tools
Ad platforms like Google Ads and Apple Search Ads have free keyword planner tools. Enter seed keywords, and it will provide monthly search volume data. Look for mid-to-high volume keywords that relate to your app.
Analyze App Store Search Results
Search relevant terms in the app store and see what comes up. The suggested search terms can provide useful keyword ideas. Also, look at the keywords your competitors are ranking for.
Identify Long-Tail Keywords
Don’t just focus on high-volume single keywords. Also, target longer, more specific long-tail keywords that have less competition. These help attract very targeted users.
Consider Semantic Keyword Variations
Include synonyms, related phrases, and semantic variations of your primary keywords. For example, “meditation” can also be “guided meditation”, “meditate” or “meditation techniques”.
Track Keyword Performance
Use analytics to see which keywords are driving the most conversions. Optimize for keywords sending quality users. Iteratively expand your keyword list based on performance data.
The key is to identify a targeted yet comprehensive keyword list with a blend of high, medium, and low competition terms. This provides visibility for your top keywords while capturing long-tail traffic through specific phrases. Start broad and continually refine keywords based on real data.
2. Optimizing App Title
Choosing the right title for your app is crucial for App Store Optimization. The app title is the first thing users see when browsing the App Store, so it needs to capture their attention and convince them to check out your app.
The app title has a 30 character limit on iOS and 50 characters on Android. This means every character counts, so you need to choose them wisely to highlight your app’s key functions and differentiators.
Here are some best practices for optimizing your app title:
- Include the 1 or 2 main functions of your app – e.g., a camera app could be “Simple Camera & Photo Editor”. This gives users an immediate idea of what your app does.
- Front-load the title with your core keywords. Put the most important words first so they catch the user’s eye.
- If your app name is generic, add a brand name or descriptor – “Calorie Counter – MyFitness App”. This helps you stand out from competitors.
- Use power words that create interest – “Instant”, “Easy”, “Simple”, “Free”. But don’t overdo it.
- Tighten up long app names by removing articles, prepositions or repetitive words.
- Consider abbreviations if you’re short on space – “Camera & Photo Edit” instead of “Camera and Photo Editor”.
- Read your title out loud to ensure it flows well and makes sense.
A concise, keyword-rich app title helps users quickly grasp your app’s purpose and incentivizes downloads. Continuously test variations and tweak individual words until you find the optimal balance of functionality and branding. This small effort can produce outsized benefits.
3. Writing App Description
The app description is one of the most important elements for App Store Optimization. This is where you can convince potential users why your app is useful, unique, and worth downloading.
When writing your description, focus on highlighting your app’s key features and value proposition. Explain what problems your app solves and how it makes users’ lives easier. Use clear, concise language that is easy for users to scan and understand.
Incorporate relevant keywords in a natural way to optimize for App Store search. Research keywords people search for related to your app category and functionality. Include these keywords strategically in your description but avoid stuffing or repetition.
Structure your description with short paragraphs, bullet points, captions, or highlights for scannability. Break up long blocks of text. Use formatting like bold and italics sparingly to emphasize your main selling points.
Entice users to take action with a strong call to action at the end. For example, encourage them to download your app now to access a certain feature or benefit.
Keep your tone conversational yet professional. Show users how your app can improve their lives and make their jobs easier. Back up your claims with facts, customer examples, or actual user reviews.
Writing a compelling description is vital for converting App Store visitors into loyal app users. Keep it succinct yet persuasive. Optimize it with relevant keywords. And remember to A/B test different descriptions to improve conversion rates.
4. App Icon Design
Your app icon is one of the most important visual elements for standing out on the App Store. It’s the first thing potential users see alongside your title, so it needs to grab their attention and convey what your app is about.
When designing your icon, the most important considerations are size and visual appeal.
Size Requirements
App Store icons must follow Apple’s strict size requirements:
- 1024 x 1024 pixels for the master icon
- 180 x 180 pixels for Retina display
- 120 x 120 pixels for the App Store listing
- 87 x 87 pixels for older iOS devices
Creating these correctly scaled versions ensures your icon looks crisp and clear across devices. Using a vector-based design program like Sketch is best for outputting properly sized icons.
Visual Design
Aesthetically, your icon should be simple, recognizable, and reflect your app’s personality. Solid colors and minimalism often work best. Avoid cluttered or complex designs.
It’s key that your icon stands out when users browse the App Store. Using a bold color scheme can help grab attention. Include imagery related to your app’s function so users instantly know what it’s about.
Test different versions with target users to see which best captures your brand and user intent. An appealing, memorable icon drives more taps and downloads.
👉🏾 Other Swiftspeed users also read: Complete list of top mobile app stores in 2024
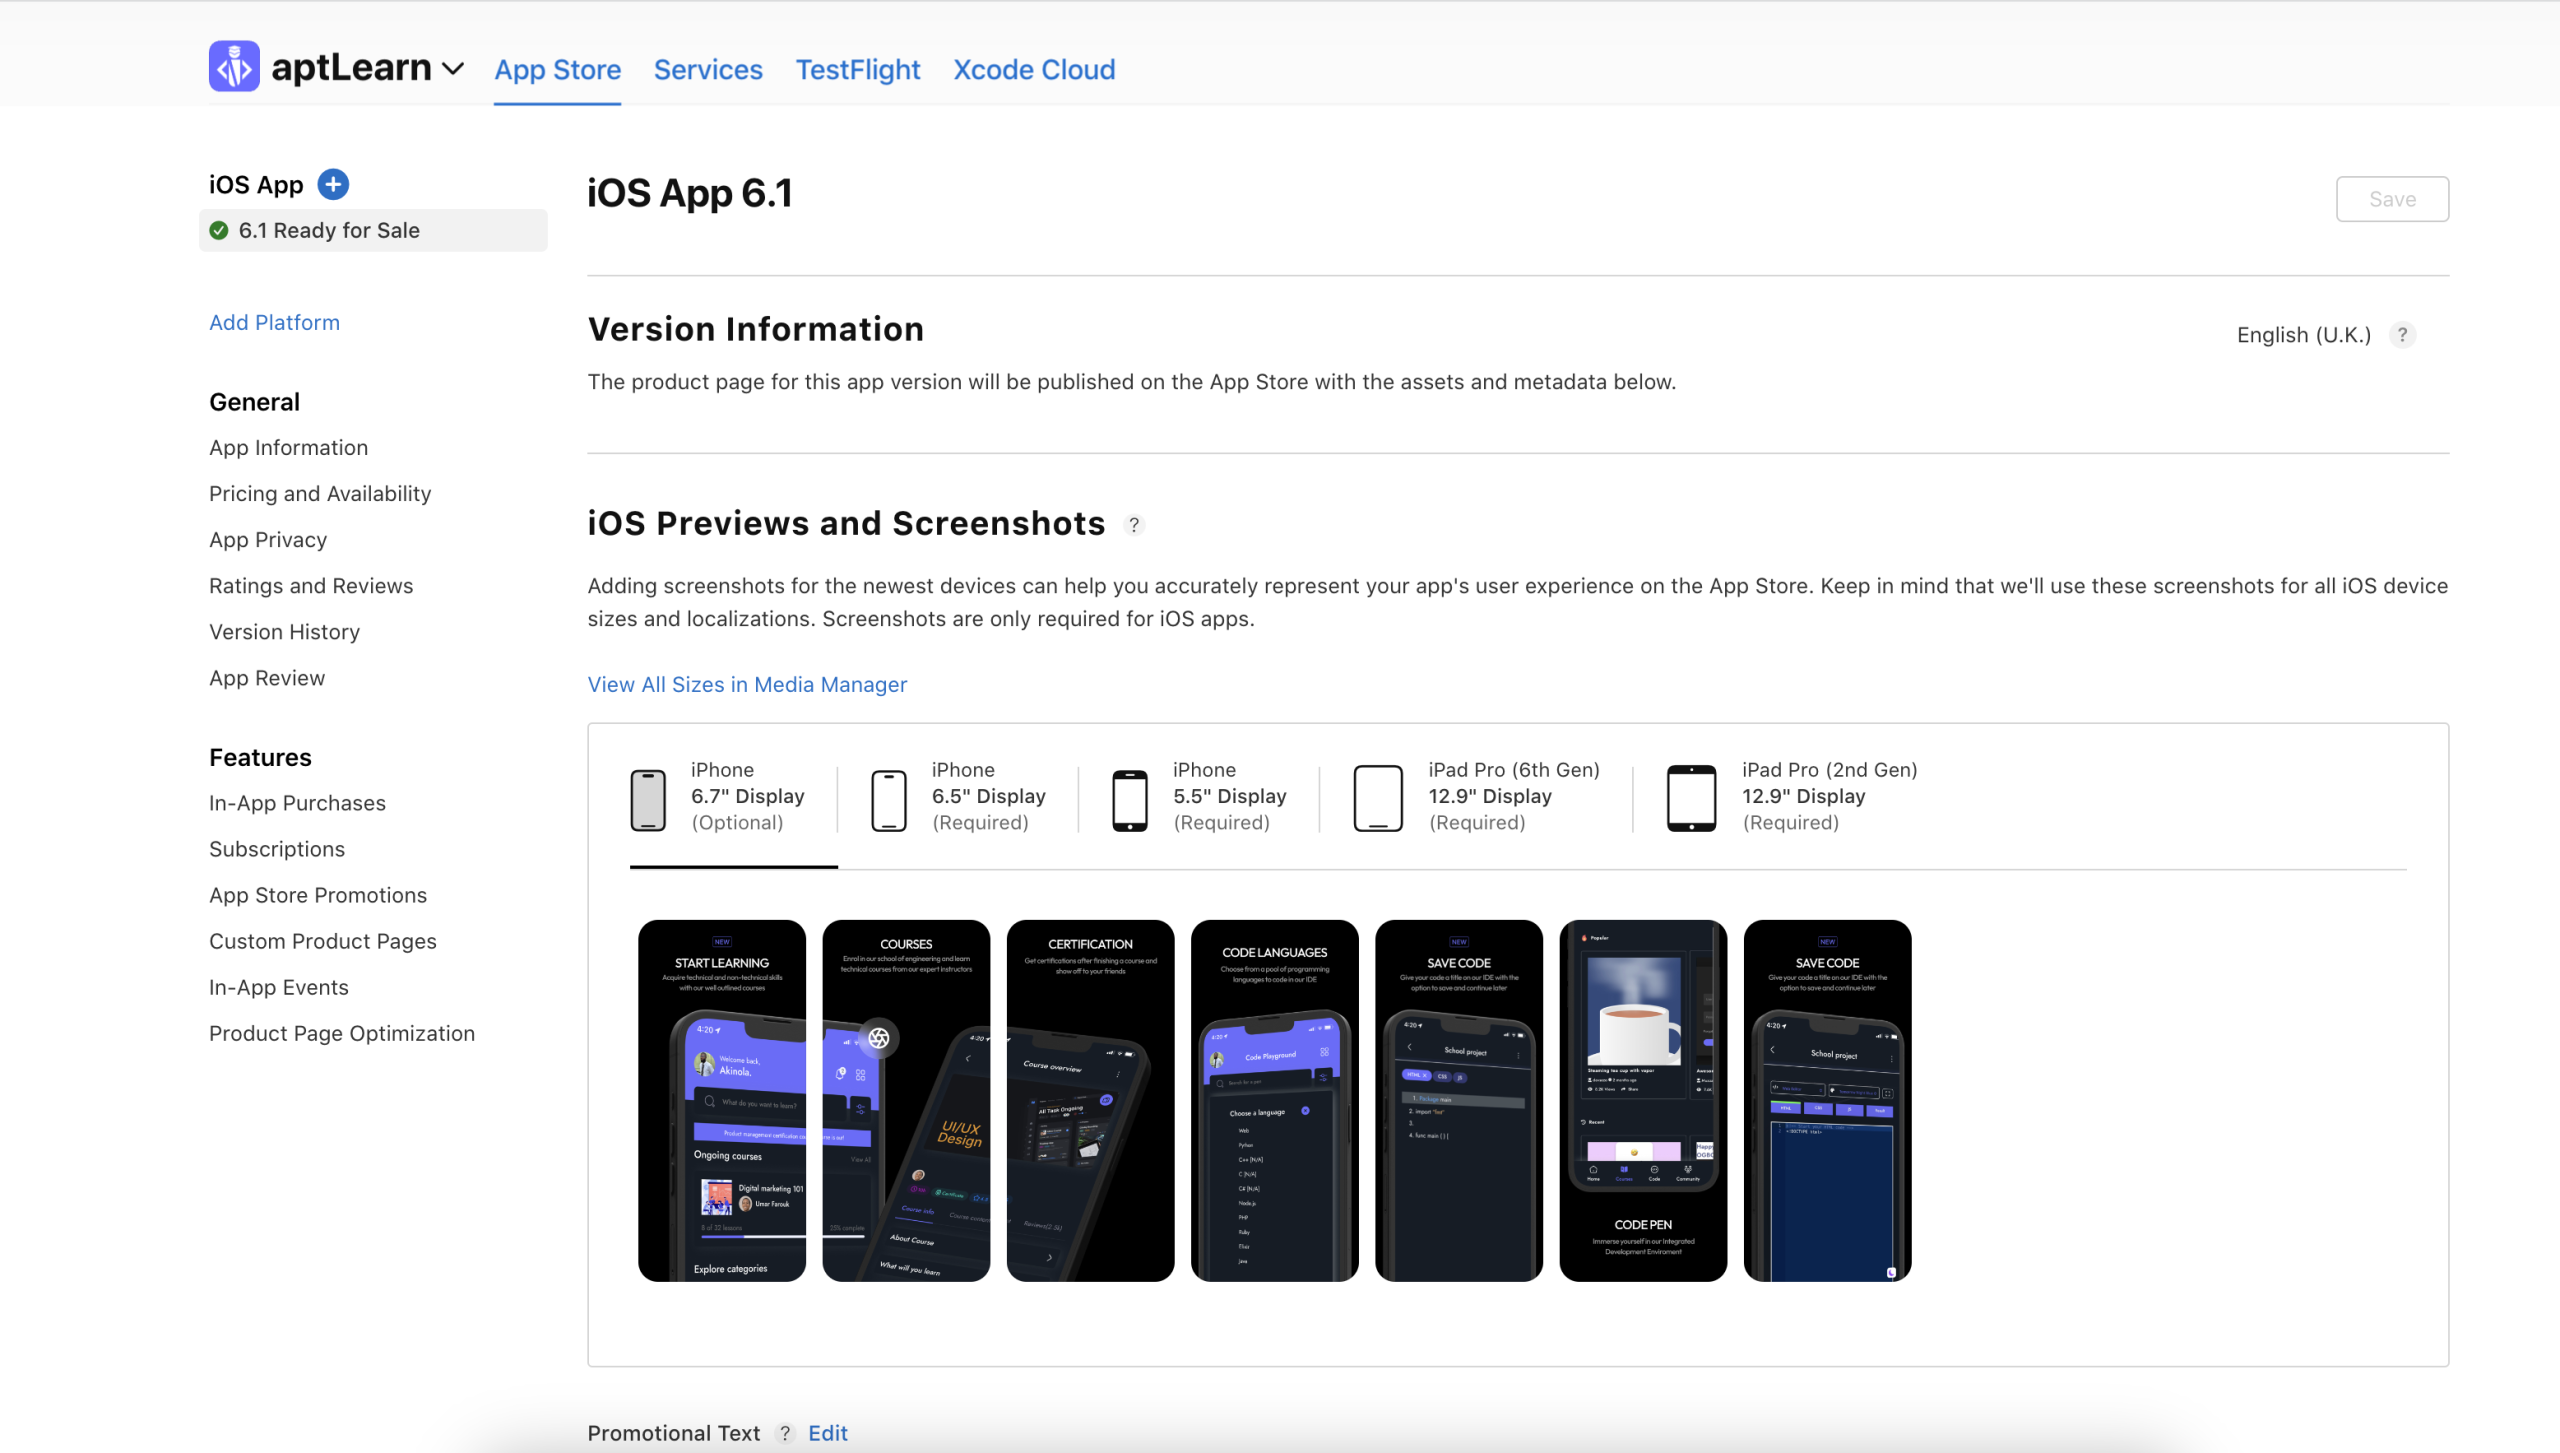
5. Screenshots
Screenshots play a critical role in convincing users to download your app. They provide a visual demonstration of your app’s key features and user experience. Follow these best practices when selecting and optimizing your app screenshots:
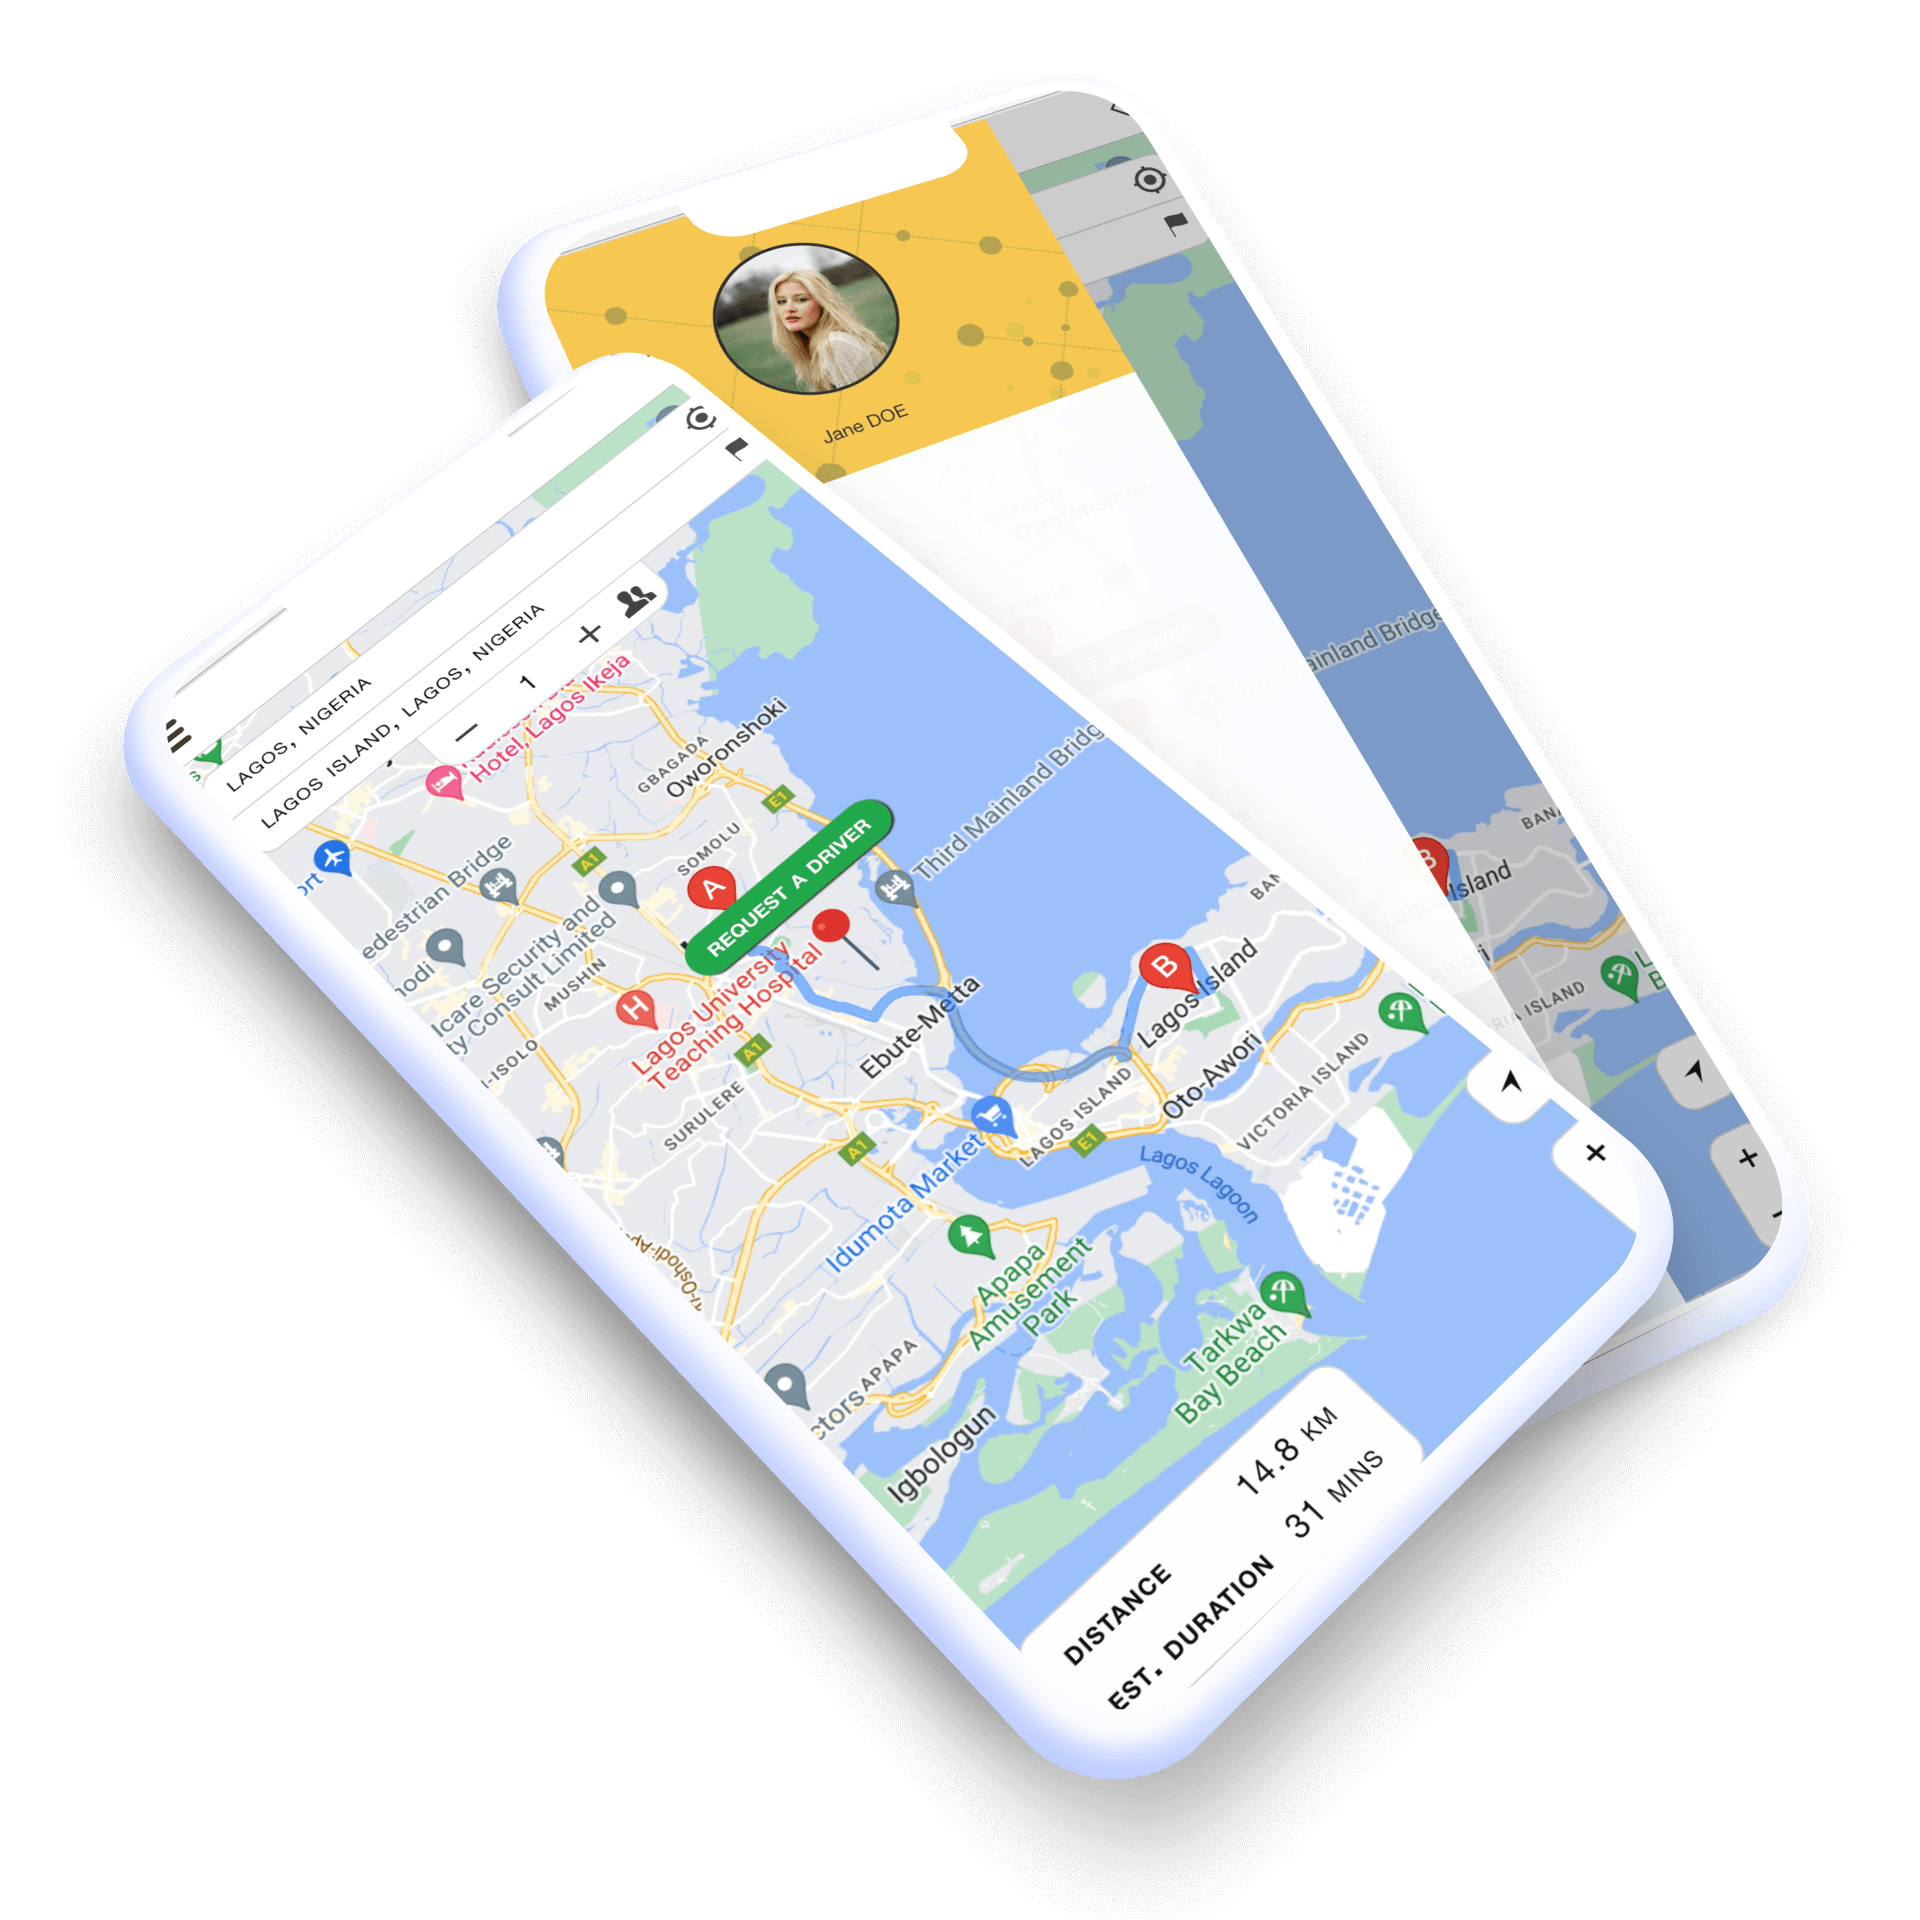
- Include at least 5 screenshots – This gives potential users enough of a preview to understand what your app is about. The App Store displays screenshots of different sizes, so you need multiple images to showcase different pages and features.
- Highlight your app’s core functionality – Identify the 1-3 key features or uses of your app. Then design screenshots that distinctly showcase each one. For example, a messaging app may want screenshots of the contacts list, chat interface, and group messaging.
- Demonstrate real use cases – Screenshots should depict realistic scenarios of how users would interact with your app. Include interface text, real content/data, and use cases specific to your target audience.
- Optimize images for clarity – screenshots should use high-resolution images that are easy to see, especially on small mobile screens. Ensure text and icons are legible.
- Localize screenshots – Translate any text in your screenshots for each language your app supports. This helps users in different regions understand your content.
- A/B test variations – Try different combinations of screenshots to see which performs better. This can help identify which features resonate most with your audience.
- Update over time – As you add new features or redesign your app’s interface, update your screenshots to reflect the changes. This keeps your App Store listing fresh.
Effective screenshots visually communicate the value of your app. They play a big role in conversion rates, so optimize them to highlight your app’s best features.
6. Localization
Localizing your app for international markets should be a key priority. With over 60% of app downloads coming from outside the US, targeting global users represents a major growth opportunity.
To localize effectively, the app title, description, screenshots, and in-app text should all be translated into the native languages of your target countries. Professional translators should handle this to avoid mistakes.
When translating, it’s important to consider cultural differences. Humor, references, imagery, and features that resonate in your home market may not translate elsewhere. Do research to understand each culture’s values, norms, and communication style.
For example, apps focused on social connections are often more popular in Latin America and Southern Europe, where cultures tend to be more relationally oriented. Dating apps need different marketing messages in individualistic vs. collectivist countries.
Colors can have different meanings across cultures too. Red is positive in China but negative in South Africa. Icons should also be culturally relevant.
Making your app feel locally made, not just translated, will boost engagement and conversions abroad. Take the time to tailor the user experience for each key market. Global success requires understanding your international users.
7. Ratings and Reviews
User ratings and reviews are crucial ASO factors that can make or break your app’s success. App store algorithms often prioritize apps with more positive ratings and reviews. Therefore, app developers must make customer satisfaction and generating positive ratings a top priority.
It’s important to respond professionally and helpfully to negative feedback. Even if a review seems unreasonable, avoid arguing or getting defensive. Thank the user for taking the time to provide feedback, apologize for their poor experience, and clarify how you plan to address any issues mentioned. If relevant, ask for clarification on their specific problems or follow up privately to resolve matters.
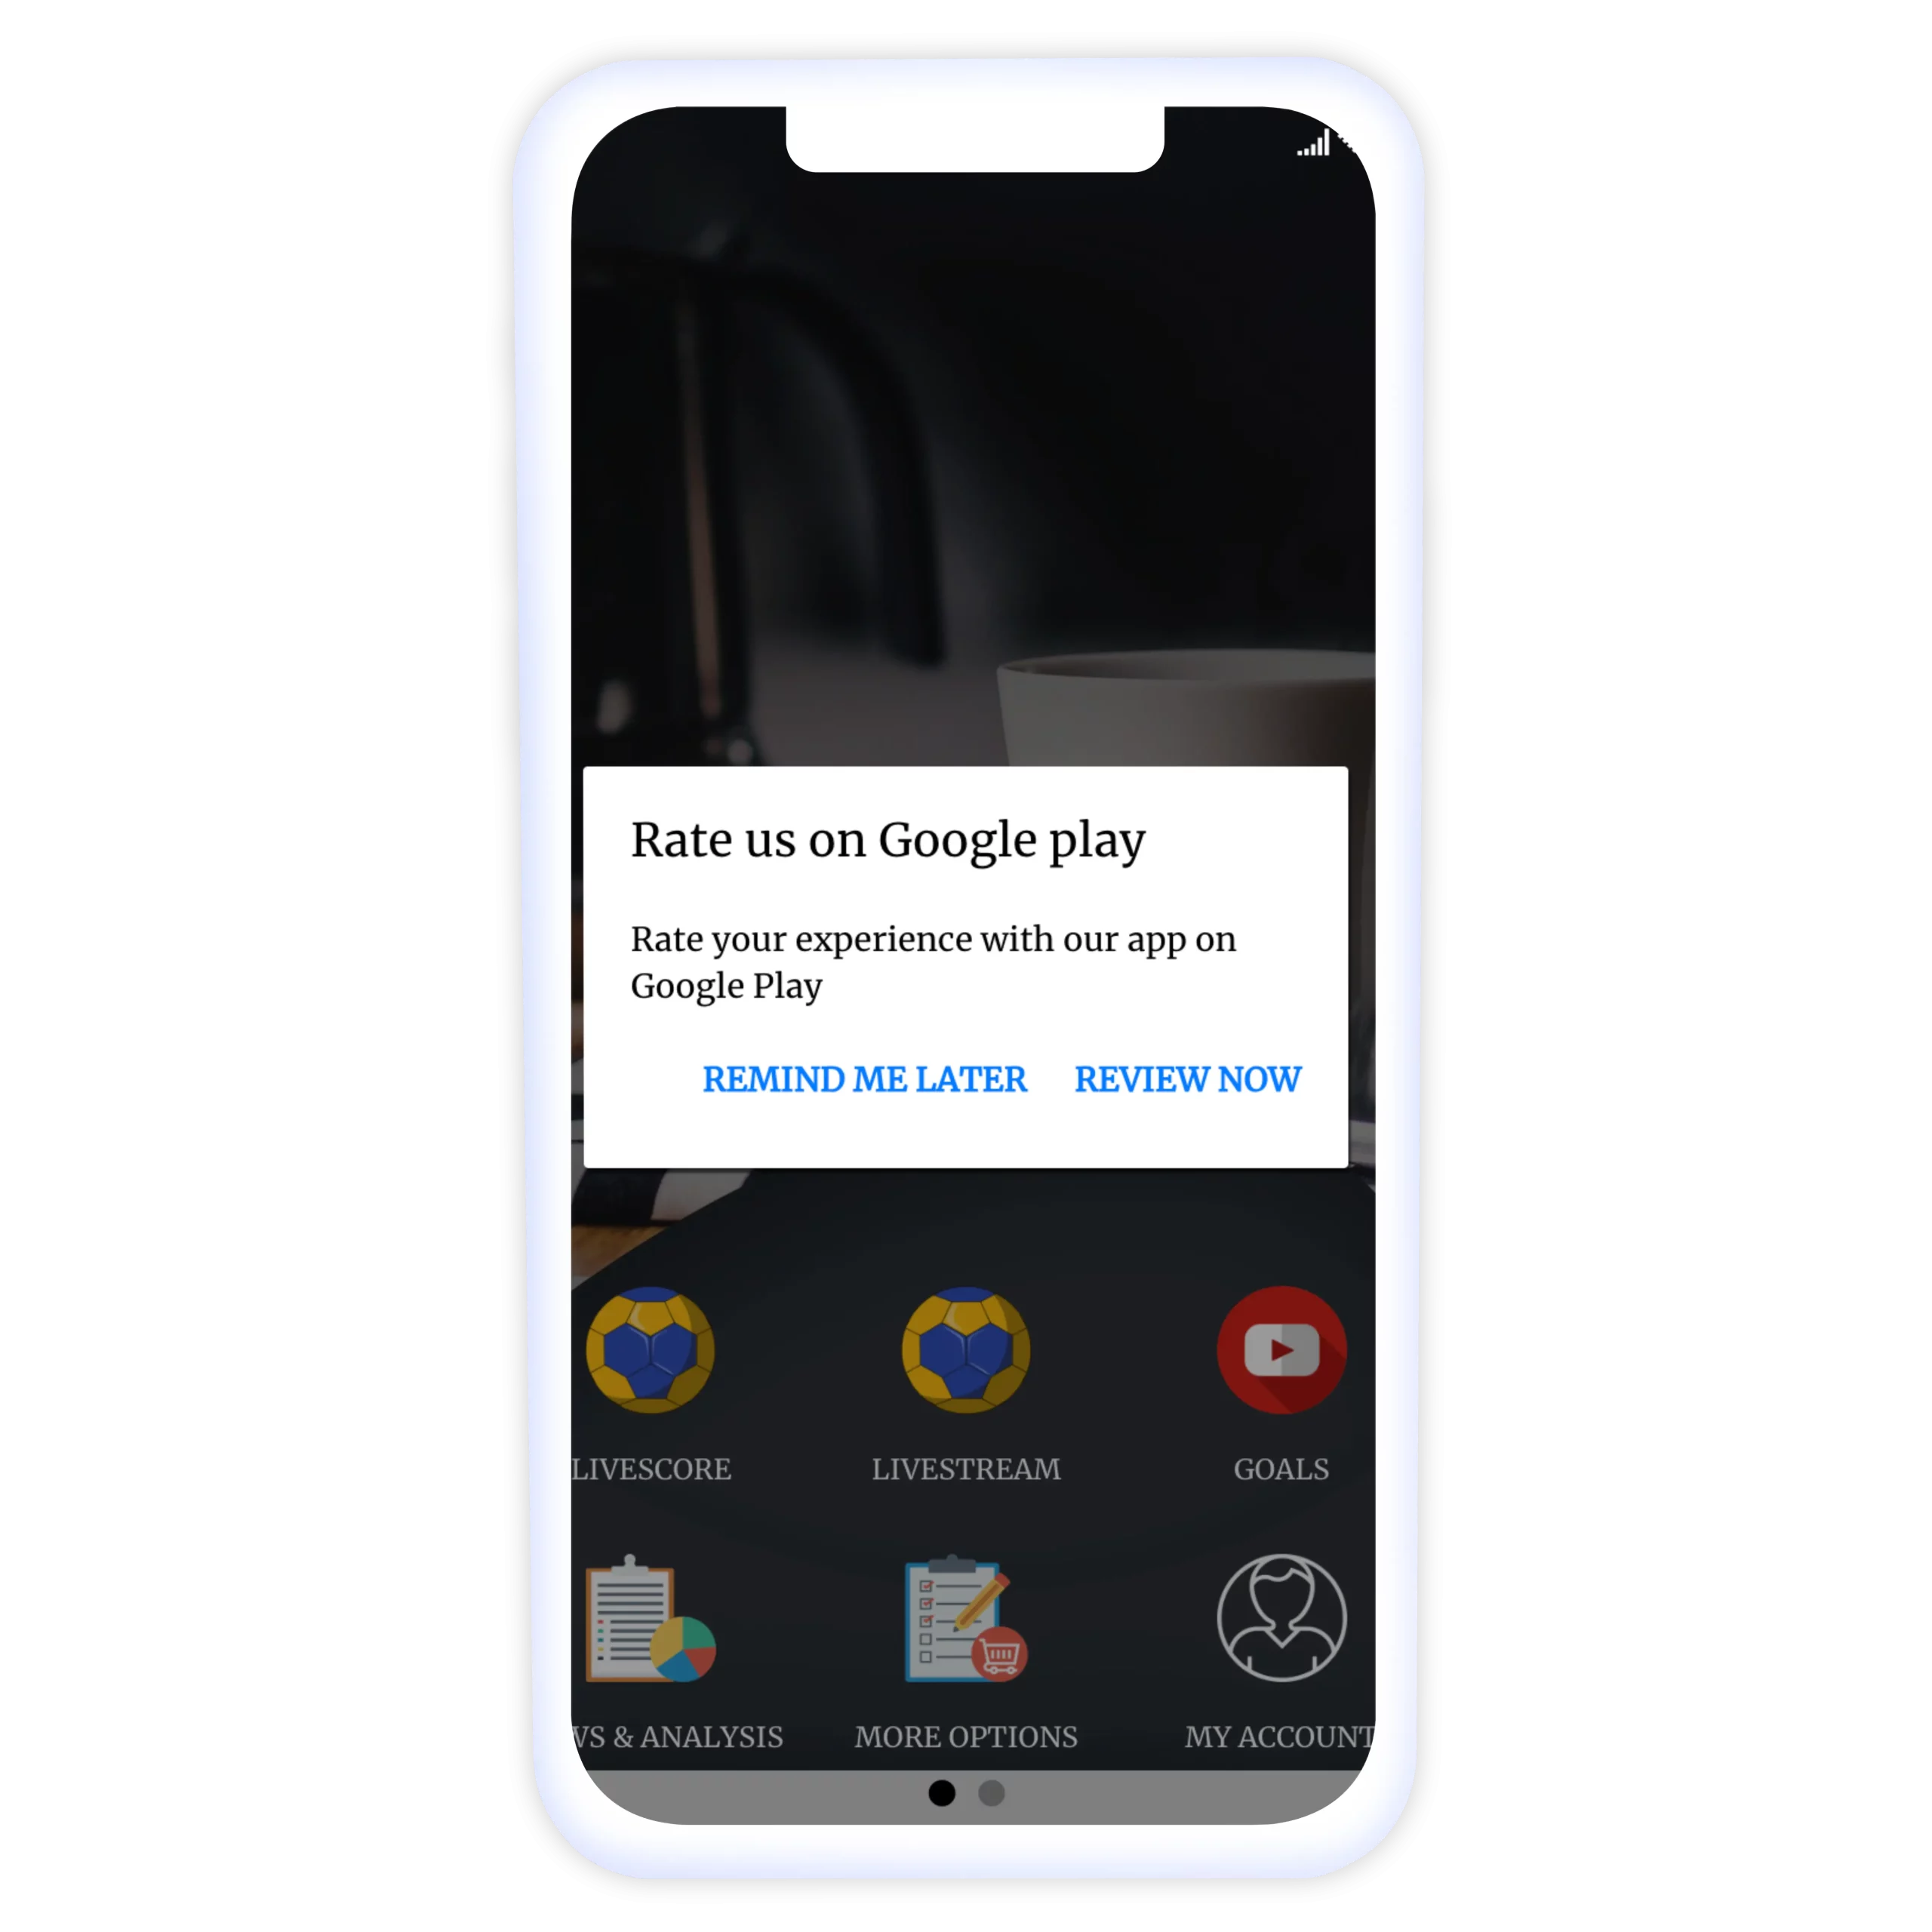
You should also proactively encourage positive reviews from satisfied users. Consider displaying prompts within the app at appropriate times, like after a user has used it for a while or completed a key action. The prompt can highlight the value they get from your app and gently ask them to leave a rating or quick review. Just avoid being too aggressive or frequent with review requests.
Managing user feedback well can gradually improve your rating over time. This, in turn, lifts your app in rankings and store searches, driving the all-important organic downloads.
8. A/B Testing
A/B testing, also known as split testing, is a powerful tool for optimizing your app store listing. It allows you to experiment with different variations of your app title, description, icon, and screenshots to see which ones perform better.
To run an A/B test:
- Create two (or more) variations of one element in your app store listing, such as the app title or the app icon. Make sure the variations are noticeably different.
- Submit the variations to the app store and promote the app as usual.
- After a set period of time (e.g., 1-2 weeks), analyze the results. Look at metrics like a number of downloads, conversions, click-through rate from the app store page, and reviews.
- The variation that performs better by your chosen metrics is the winning variation. Replace the old listing with the winning variation to optimize performance going forward.
- It’s often useful to iterate by testing additional variations against the winning variation from the first round of tests. This allows you to continually refine your listing over time.
A/B testing removes the guesswork and ensures you have an optimized listing using actual user data. It enables you to experiment freely without the risk of tanking your app’s performance. With persistence and iteration, A/B testing can greatly improve conversions and downloads from the app store.
Build Android and iOS Apps with Swiftspeed
Create premium apps without writing a single line of code, thanks to our user-friendly app builder. Build an app for your website or business with ease.
9. Tracking Performance
Once your app is live in the app store, it’s important to continually track and monitor its performance so you can optimize over time. Here are some key metrics to keep an eye on:
- Downloads and conversions – How many people are downloading your app? What percentage of visitors or impressions are converting into downloads? Are there any trends over time?
- Ratings and reviews – Monitor your app’s overall rating and the number of reviews. Read through reviews regularly to see what users like/dislike about your app and if any consistent issues are coming up that need addressing.
- Churn and retention – Look at what percentage of users open the app again after downloading. How long are people using your app before churning? High churn may indicate problems with onboarding or ongoing engagement.
- Revenue and LTV – If your app is monetized, track revenue over time. Look at metrics like average revenue per user and customer lifetime value. An increase in downloads but a drop in revenue can signal issues.
- Store ranking – Where does your app rank for relevant keywords? How is this changing over time? Drops in rank can indicate problems.
- Competitor performance – Keep an eye on competitors’ rankings, ratings, downloads, and so on. This can reveal if problems are industry-wide or specific to your app.
👉🏾 Other Swiftspeed users also read: The Ultimate Guide to iPhone Screen Resolutions and Sizes in 2024
Conclusion
Optimize your app listing for the App Store, and you’ll see a significant increase in organic downloads and app installs.
Summary
Summarily, implementing effective App Store Optimization (ASO) techniques is crucial for app builders looking to improve visibility and attract more organic users. By optimizing your app listing, you can increase your chances of being discovered by potential users in the crowded app stores.
To summarize the key points discussed in this blog post:
- Understand your target audience and their search behavior to optimize your app’s metadata, including title, keywords, and description.
- Conduct thorough keyword research to identify relevant and high-ranking keywords to include in your app listing.
- Build an attractive and compelling app icon and screenshots that accurately represent your app’s features and benefits to entice users to click.
- Encourage positive reviews and ratings from satisfied users by providing a seamless and enjoyable app experience.
- Regularly track and analyze your ASO efforts using app analytics tools to identify areas for improvement and optimize your strategy over time.
By following these ASO best practices, you can increase the visibility of your app, attract organic users, and ultimately improve your app’s overall success in the competitive app store landscape.
App Store Optimization (ASO) is a must for any app builder. If you want to be successful in the App Store, you need to optimize your app listing. This means optimizing your app for keywords, images, and other aspects of the app listing.


